Posted October 16, 2023

By Sean Ring
Boring Charts… Except This One.
- I’ve gotten bored staring down charts lately.
- They don’t speak to me like they used to.
- But this one makes me lose sleep.
Good morning from autumnal Asti.
On August 31st, I wrote “Why We Don’t Feel Fed Hike Pain Yet.”
Societe Generale (a French bank with a Wall Street and City of London presence) had found something fishy.
Albert Edwards, SocGen’s famous permabear, wrote that corporate interest payments kept falling as the Fed was hiking rates. That’s odd, to say the least.
His team concluded that the “S&P 150,” or the largest 150 companies in America by market capitalization (stock price x number of outstanding shares), could refinance their debt at lower rates. That is, they did the same thing savvy homeowners did during the pandemic: they traded their existing higher interest rate debt for new lower interest rate debt.
The gist is that not all companies can do this, especially small businesses. (If the other 350 large-cap stocks in the S&P 500 couldn’t refinance, the smaller 2,000 companies that make up the Russell 2000 surely couldn’t.)
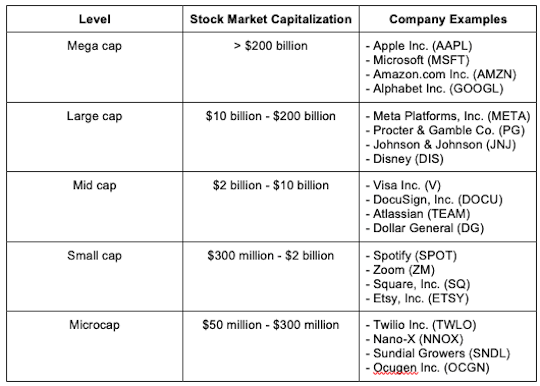
Before we go on, here’s a handy table for you:
Edwards' research concluded we should watch the IWM (or Russell 2000 ETF) for signs of weakness.
Before I show you the charts, let’s make sure you understand the Russell 2000:
The Russell 2000
The Russell 2000 is a financial index that doesn't steal the limelight like its celebrity cousins, the S&P 500 or the Dow Jones Industrial Average.
However, in terms of getting a natural feel for the market, especially the small-cap universe, this index is gold dust for traders and investors.
Let's begin with the basics: The Russell 2000 index tracks the performance of about 2,000 small-cap companies in the United States. These firms have a market capitalization range between $300 million and $2 billion.
Created by Frank Russell Company in 1984, this index serves as a benchmark for small-cap stocks in the United States, akin to how the S&P 500 represents large-cap stocks.
Here's the kicker: While most people tune their financial antennas exclusively to the ups and downs of blue-chip giants like Apple, Microsoft, or Google, focusing on the Russell 2000 provides an alternative and more nuanced picture of market conditions.
You see, small-cap companies are typically more susceptible to economic shifts, both good and bad because they don't have the financial buffers or diversified revenue streams that large-cap companies do.
When the economy's revving up, these small players can experience explosive growth, which is reflected in a booming Russell 2000.
Conversely, economic downturns often hit them first and hardest, making the Russell 2000 a canary in the coal mine for market troubles ahead.
Now, let's talk about numbers. Unlike the Dow, which is price-weighted, the Russell 2000 is market-capitalization-weighted, like the S&P 500. This means that companies with a higher market cap influence the index's value more. Still, given that we're dealing with small-cap stocks, the largest company in the Russell 2000 is a minnow compared to the blue whales in the S&P 500.
The Russell 2000 also has diversified sectors.
While the S&P 500 leans heavily on technology stocks, the Russell 2000 offers a smorgasbord of industries from healthcare to financials, from industrials to consumer discretionary. This diversity makes it an excellent vehicle for investors seeking exposure to the broad U.S. small-cap market without picking individual stocks. Many do this through ETFs like the iShares Russell 2000 ETF (IWM).
We’ll talk about the ETF in a moment.
This index epitomizes the dynamism and entrepreneurial spirit of the American economy. It highlights businesses that aren’t entrenched behemoths but agile and innovative enterprises, often responsive to local or specialized markets.
The Charts That Keep Me Awake
The IWM Chart
First, the IWM (Russell 2000 ETF) chart:
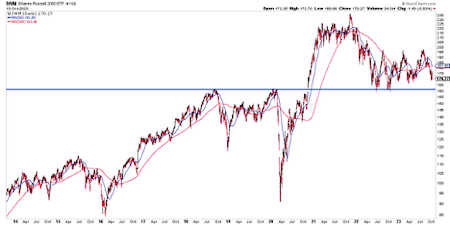
That blue line, at the $161 level, indicates a resistance level (until late 2020) that turned into a support level afterward. Technical analysts call this a “change of polarity.”
We bounced off that level twice in 2022. We’ve not tested it, as yet, in 2023.
On the contrary, those higher highs are cause for optimism. However, if we break down hard and go below $161, that spells big trouble for small caps and the underlying economy.
Some charts are already looking at $149 as the first target. Again, we’re not there yet.
The IWC Chart
What’s scarier is what’s happening in the microcaps. The IWC, the iShares Microcap ETF, has definitively broken down.
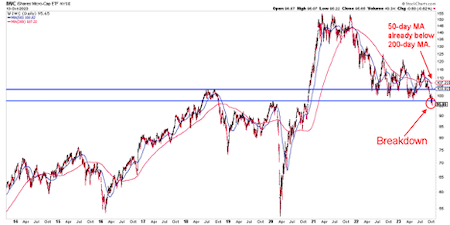
Those two blue lines, at 103.75 and 97.75, represent the top and second peak, respectively, before Covid. They created more of a “zone” than a definitive “line” of resistance/support.
From here, the next target is $77.
However, this represents something much more important: it may be the first domino to fall.
Since the IWC has broken down, the IWM may be next. Then the Nasdaq, and finally, the S&P 500.
What To Do
The Rude is a free daily; its mission is not to give you stock picks. However, there are things to look at.
If you’re aggressive, you can look at puts on the IWC that’s already broken down and still has considerable downside. Unfortunately, I could see no open interest (liquidity) in that option.
You could look at IWM puts as well. Or, if you’re feeling brave, you can buy the RWM (inverse IWM ETF). But I must warn you that you mustn’t hold this for long. Inverse ETFs are meant for short-term plays. The longer you keep it, the less your return will look like it should.
The safe thing to do is to use these ETFs to monitor the NDX and SPX, so you know when to sell if it comes to that.
I’ve been bullish lately, so these charts leaped out at me. But the dominos have stopped falling if the IWM doesn’t fall through its support level.
Wrap Up
Let’s keep our heads about us.
If we continue to monitor the things that matter, we’ll know when to bail out of positions.
Right now, it’s time to take a deep breath, watch with keen eyes, and act when it’s time to act.

Have a wonderful week!

And The Queen’s Bank Was No More…
Posted January 16, 2026
By Sean Ring

Passing Notes to Avoid War
Posted January 15, 2026
By Sean Ring

RIP, Scott Adams
Posted January 14, 2026
By Sean Ring

Worldwide Whack-A-Mole
Posted January 13, 2026
By Sean Ring

Powell Subpoenaed For Fed Renovations, Horrifying Wives Everywhere
Posted January 12, 2026
By Sean Ring