Posted August 03, 2026

By Sean Ring
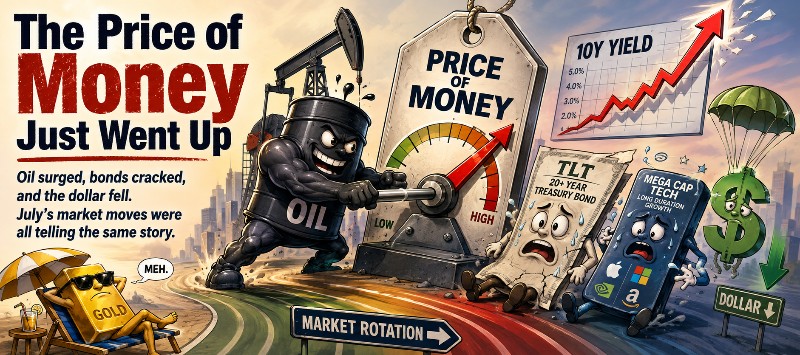
The Price of Money Just Went Up
It’s about to get fun out there. With not only the 10-year yield popping, but the long bond (30-yr) yield also hitting new highs, we're in for the bond vigilantes reasserting themselves.
Pair that with the USDJPY intervention and crack spreads (between crude and gas and diesel) widening, we may be witnessing an economic reckoning the equity market is completely blind to.
I’ll cover all those events later this week in the Rude. But for now, let’s try to get a bird’s-eye view of the markets from a chart perspective.
July's table looks quiet at the index level and violent underneath. Thanks to more SPR releases, a supply-driven surge in crude dragged the 10-year sharply higher. Every asset with duration in it, such as long Treasuries, investment grade, and mega-cap tech, paid the bill.
But what makes the month genuinely interesting is what didn’t happen.
The dollar fell while yields rose, which is the classic signature of a term-premium move rather than a growth or policy repricing. Foreign capital is demanding more compensation, not chasing carry. Gold, handed an energy shock and a softer dollar, managed almost nothing, and silver went backward.
Credit refused to widen…for now. Copper rose alongside oil. Crypto bounced hard off deeply oversold levels without repairing a single trend.
Read together, this was neither a risk-off month nor a growth scare. It was the market marking up the price of money and sorting assets accordingly.
Let’s get to the charts.
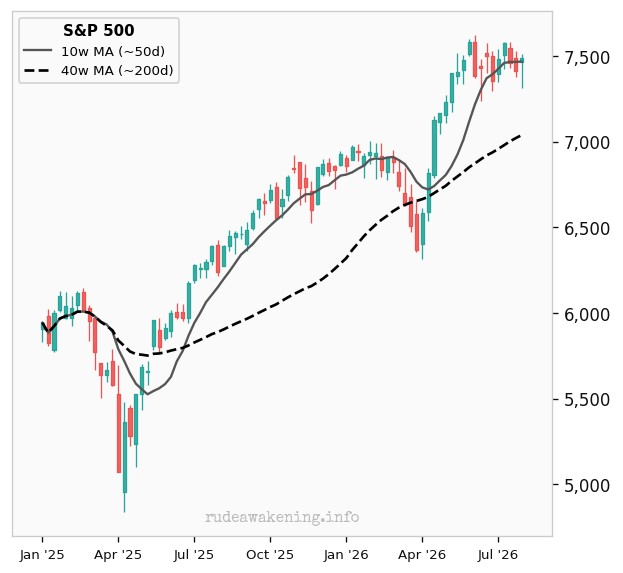
| June Close | 7,499.36 | Month-to-Date | -0.1% |
| July Close | 7,489.72 | Quarter-to-Date | -0.1% |
| Trend | Bullish | Year-to-Date | +9.4% |
A flat month in the face of a 32bp move in the 10-year Treasury yield (10s) is arguably the strongest thing equities did all year. The index absorbed a discount-rate shock via rotation, with energy and cyclicals offsetting the long-duration complex. The uncomfortable arithmetic is that the equity risk premium against a 4.74% risk-free rate is now essentially nil. That leaves the market dependent on earnings delivery rather than multiple support, which is much less forgiving.
Nasdaq Composite
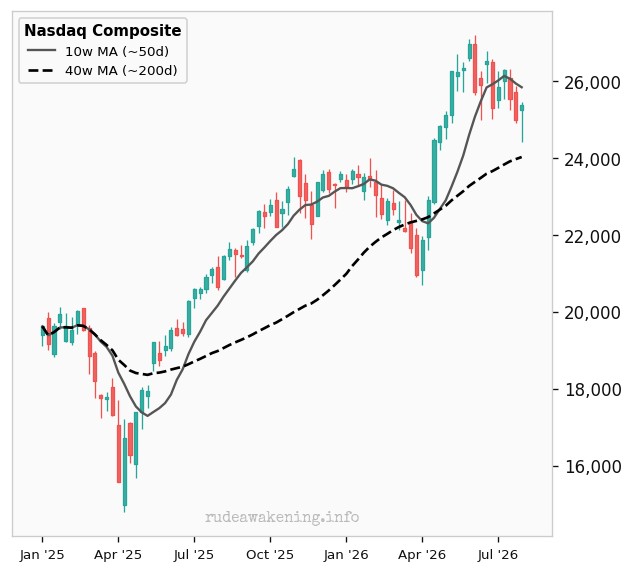
| June Close | 26,214 | Month-to-Date | -3.2% |
| July Close | 25,374 | Quarter-to-Date | -3.2% |
| Trend | Caut. Bullish | Year-to-Date | +9.2% |
Three points of underperformance versus the S&P in a single month, with no obvious deterioration in fundamentals, is the denominator doing the work. Mega-cap tech has been treated as a bond substitute for two years;July was the reminder that the trade cuts both ways. A close below the 10-week for the first time in a while matters less than whether the AI capex narrative can keep absorbing a higher hurdle rate.
Russell 2000
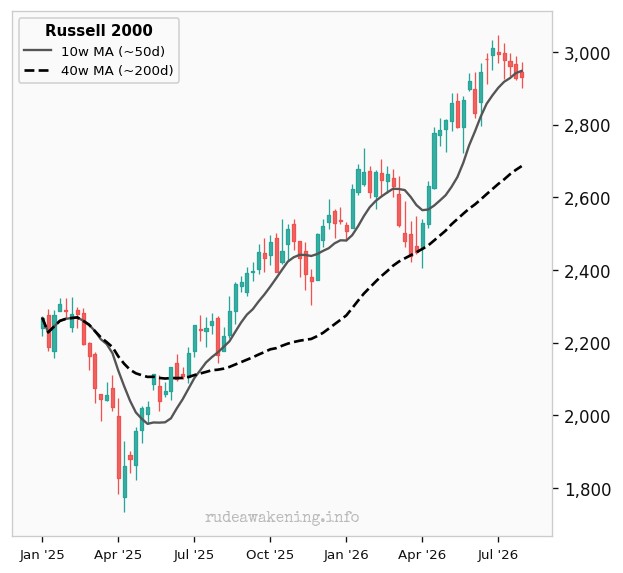
| June Close | 3,024.37 | Month-to-Date | -3.1% |
| July Close | 2,931.34 | Quarter-to-Date | -3.1% |
| Trend | Caut. Bullish | Year-to-Date | +18.1% |
Small caps still lead comfortably on the year, which sits awkwardly with the fact that they are the most exposed cohort to floating-rate debt and refinancing at 4.74%. The reflation trade that drove their YTD gain and the rate move that hurts their balance sheets have the same source. Watch whether the 10-week holds;if the leadership breaks here, it undermines the entire domestic-cyclical thesis.
US 10-Year Yield
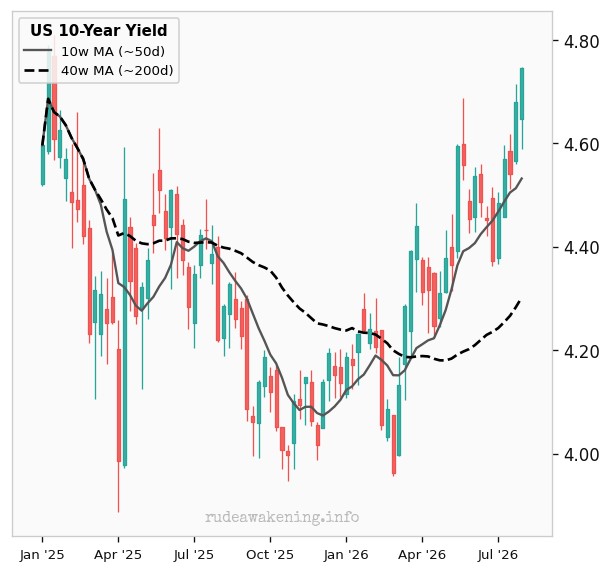
| June Close | 4.42% | Month-to-Date | +7.4% |
| July Close | 4.74% | Quarter-to-Date | +7.4% |
| Trend | Bullish | Year-to-Date | +14.0% |
The important detail is the company this move kept:yields up, dollar down. That combination points to term premium and fiscal risk compensation rather than hawkish Fed repricing, and it is a materially worse backdrop for long-duration assets than a growth-driven selloff would be. With energy feeding headline inflation, the market has quietly priced out the easing path;a test of 5% is now a live scenario rather than a tail.
US Dollar (DXY)
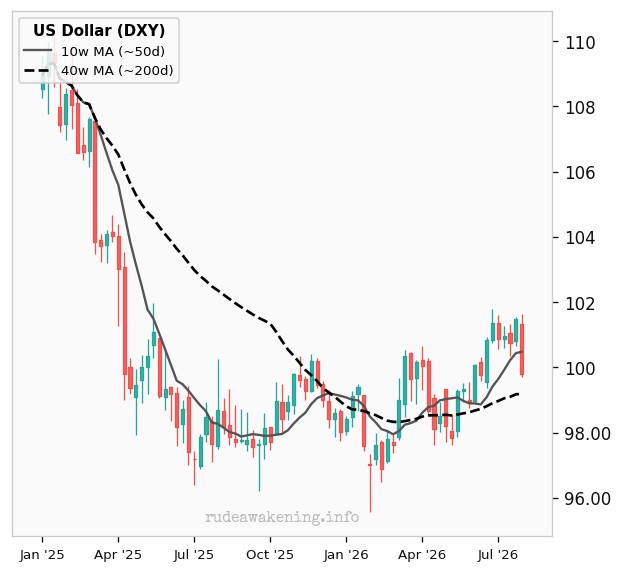
| June Close | 101.19 | Month-to-Date | -1.4% |
| July Close | 99.80 | Quarter-to-Date | -1.4% |
| Trend | Caut. Bullish | Year-to-Date | +1.5% |
A currency that falls while its bond yields rise is telling you something about the quality of the flows, not just the level. This is the crack in the US-exceptionalism trade that has been anticipated for two years and repeatedly failed to appear. Second-order effect:a softer dollar amplifies the commodity move, which feeds back into yields. That’s a small but self-reinforcing loop worth respecting.
TLT (20Y Bond)
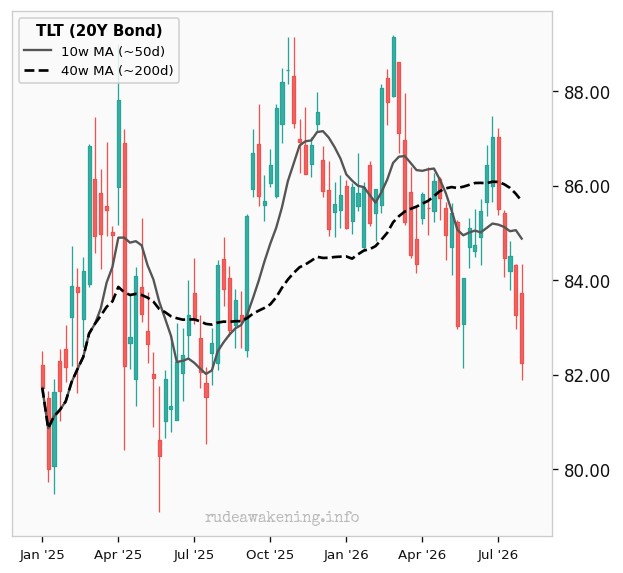
| June Close | 86.10 | Month-to-Date | -4.5% |
| July Close | 82.25 | Quarter-to-Date | -4.5% |
| Trend | Bearish | Year-to-Date | -3.5% |
The 40-week has capped every rally attempt this cycle and did so again;long duration remains a repeatedly-punished consensus trade. The problem for buyers is that the pain is coming from term premium, which has no natural mean-reversion anchor the way policy-rate expectations do. Until the fiscal and inflation backdrop changes, this is a tactical instrument, not an allocation.
LQD (IG Corp)
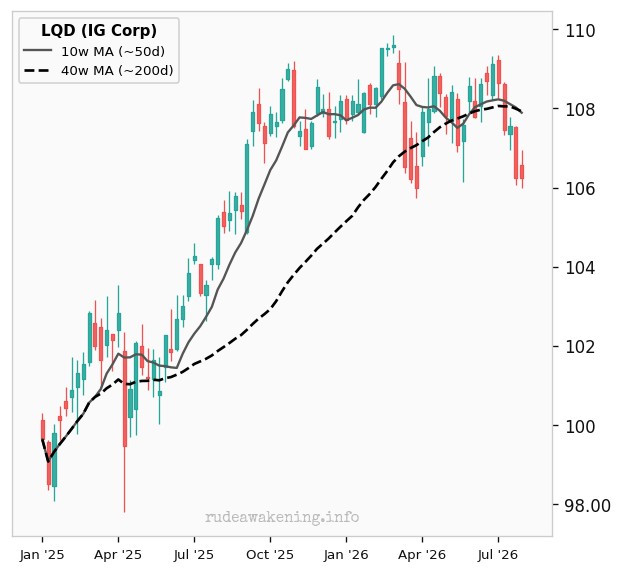
| June Close | 108.69 | Month-to-Date | -2.2% |
| July Close | 106.25 | Quarter-to-Date | -2.2% |
| Trend | Bearish | Year-to-Date | -1.4% |
Investment grade is duration wearing a credit costume, and July made the point unsubtly:spreads behaved perfectly well while the Treasury leg did all the damage. Anyone holding this as a defensive sleeve is running roughly eight years of interest-rate beta for a modest spread pickup. The relative performance versus high yield this month is the cleanest illustration available of where the risk actually sits.
HYG (High Yield)
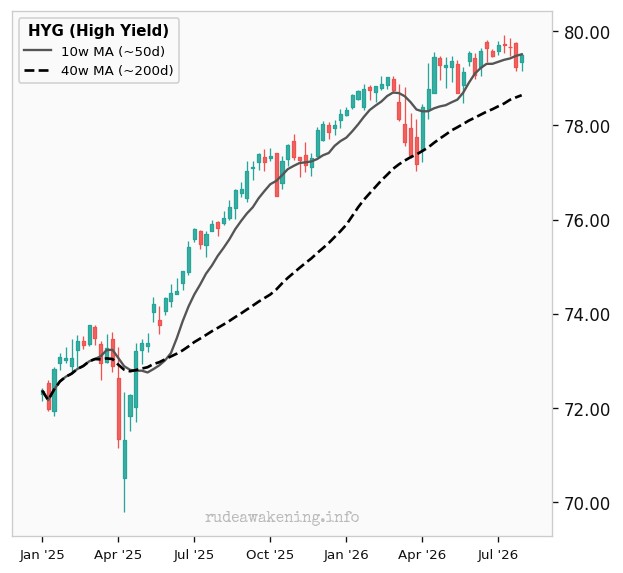
| June Close | 79.60 | Month-to-Date | -0.2% |
| July Close | 79.48 | Quarter-to-Date | -0.2% |
| Trend | Caut. Bullish | Year-to-Date | +1.5% |
Holding essentially flat while equities wobbled and Treasuries sold off is a genuine signal, not a rounding error —shorter duration plus tight spreads plus a fat coupon is exactly the profile you want in a term-premium shock. More importantly, credit is refusing to confirm any equity anxiety. If this changes, it will be the most reliable warning the table produces;for now it argues the July weakness was mechanical, not fundamental.
VNQ (Real Estate)
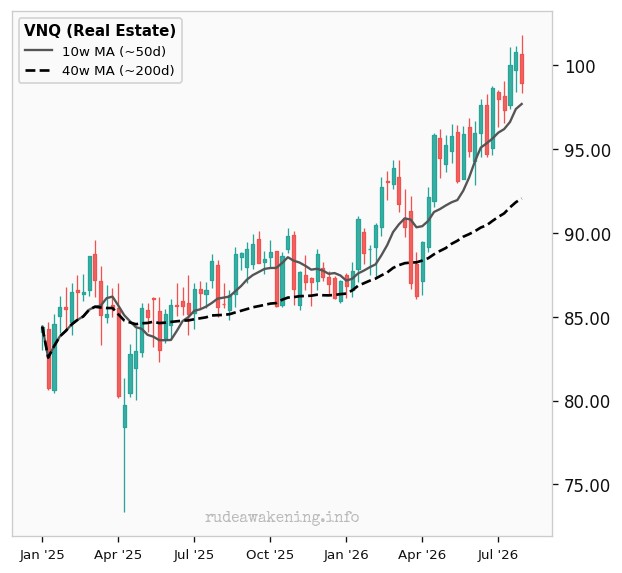
| June Close | 96.43 | Month-to-Date | +2.6% |
| July Close | 98.95 | Quarter-to-Date | +2.6% |
| Trend | Bullish | Year-to-Date | +14.0% |
Real estate rising in a month when long rates jumped breaks the standard bond-proxy relationship, and that is the point worth noting. It suggests the market is starting to treat REITs as an inflation pass-through vehicle rather than a duration surrogate. If that re-rating persists, it’s a meaningful change in how the sector trades in a higher-nominal-growth world.
WTI Crude Oil
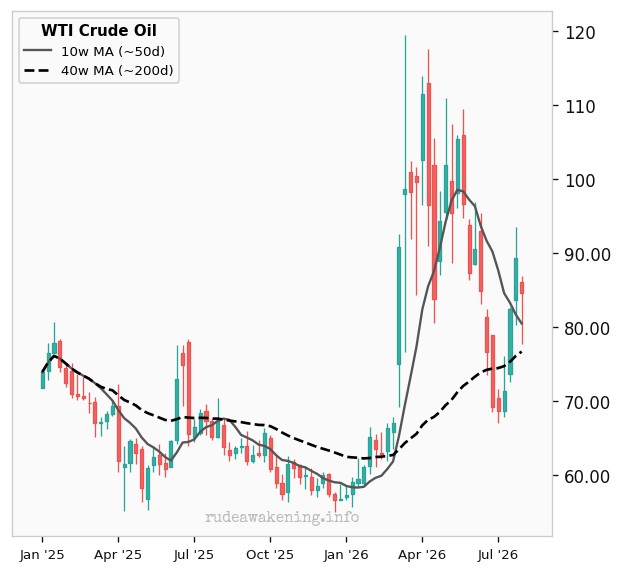
| June Close | 69.50 | Month-to-Date | +21.8% |
| July Close | 84.67 | Quarter-to-Date | +21.8% |
| Trend | Bullish | Year-to-Date | +47.5% |
A move of this magnitude in four weeks is a supply event;demand does not accelerate like that. The consequence is that crude is now the single most important input in the table. It’s what pushed the long end, what is squeezing the Fed's optionality, and what will show up in headline CPI with a one-to-two-month lag. The risk to the bullish read is that supply shocks decay quickly once the catalyst normalizes.
Copper
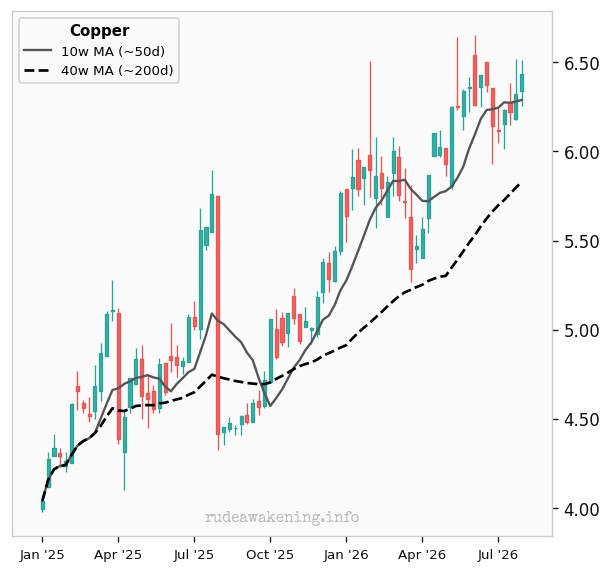
| June Close | 6.19 | Month-to-Date | +3.9% |
| July Close | 6.44 | Quarter-to-Date | +3.9% |
| Trend | Bullish | Year-to-Date | +14.3% |
Copper rallying alongside oil complicates the simple stagflation narrative. This isn’t a metal that rises on scarcity fear alone. Grid buildout, inventory drawdowns and a softer dollar are doing the work, and a rising copper/gold ratio is historically consistent with rising real yields and decent growth, not recession. It is the most credible pro-cyclical signal in the table.
Gold
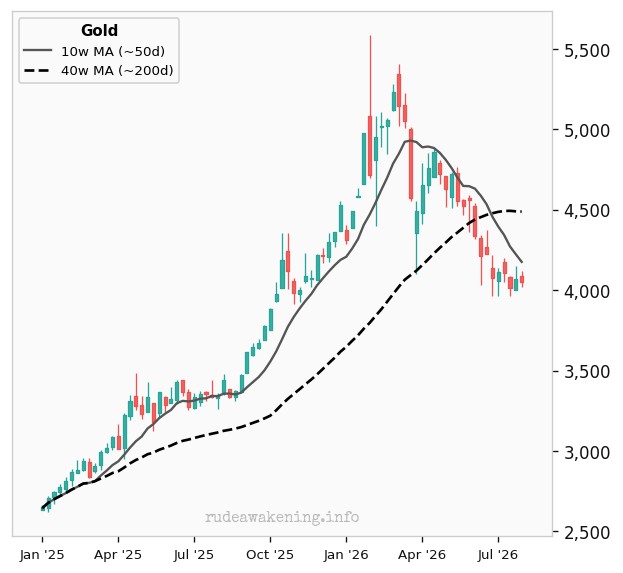
| June Close | 4,022.90 | Month-to-Date | +0.7% |
| July Close | 4,049.10 | Quarter-to-Date | +0.7% |
| Trend | Bearish | Year-to-Date | -6.4% |
The failure to respond to an oil shock, a weaker dollar, and elevated geopolitical noise is far more informative than the small monthly gain. Gold spent the prior cycle discounting exactly this environment and is now unwinding a crowded position into higher real yields. Sitting well below both moving averages, the burden of proof has shifted;the marginal question is whether official-sector demand is still absorbing supply at these levels.
Silver
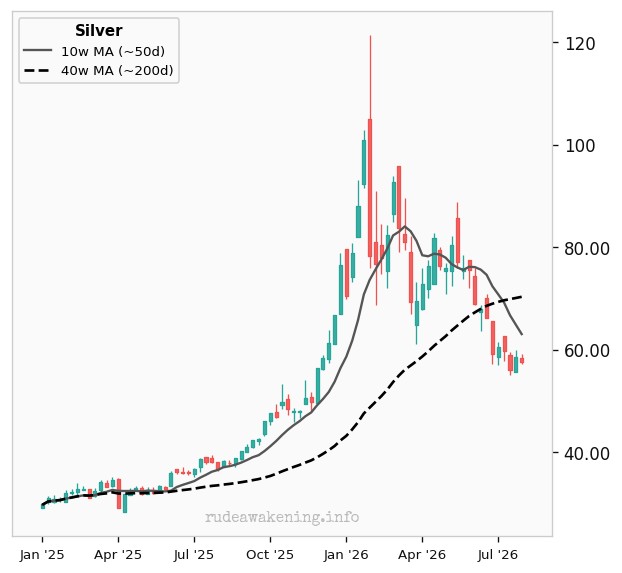
| June Close | 59.48 | Month-to-Date | -3.2% |
| July Close | 57.59 | Quarter-to-Date | -3.2% |
| Trend | Bearish | Year-to-Date | -17.9% |
Silver is behaving like a liquidation, not a macro judgment. A widening gold/silver ratio in a month when copper rose means industrial demand isn’t the problem. This is leveraged length being flushed out of the precious complex. The year-to-date figure is the honest verdict on the metals bull market:it ended, and silver is where the bill arrives.
Bitcoin
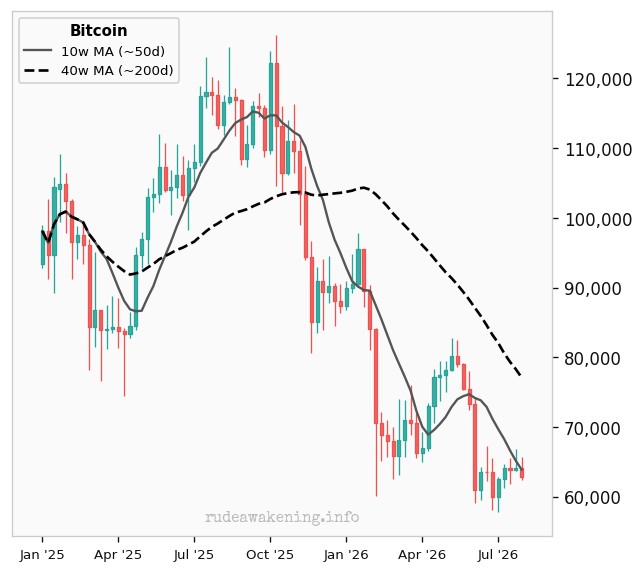
| June Close | 58,559 | Month-to-Date | +7.3% |
| July Close | 62,814 | Quarter-to-Date | +7.3% |
| Trend | Bearish | Year-to-Date | -28.2% |
A respectable bounce off deeply oversold levels that repaired nothing structurally. BTC is still beneath both moving averages, still in a defined downtrend. The more damaging point is thesis failure:presented with an inflation shock and a falling dollar, the supposed hedge didn’t respond, and has spent the year trading as a pure liquidity-beta asset. Until it can rally on a macro catalyst rather than in spite of one, treat rallies as tactical.
Ethereum
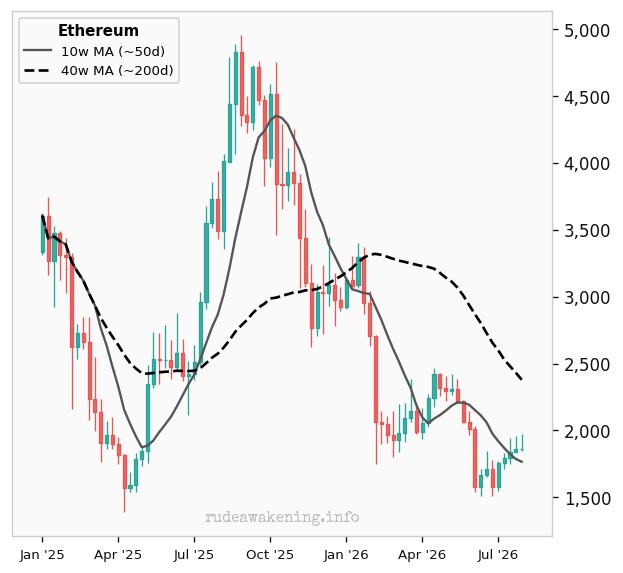
| June Close | 1,569.58 | Month-to-Date | +18.5% |
| July Close | 1,860.35 | Quarter-to-Date | +18.5% |
| Trend | Caut. Bearish | Year-to-Date | -37.3% |
The largest bounce in the complex, which is exactly what high beta does in an oversold rebound —leadership in a bear rally is a positioning signal, not a trend change. The 40-week remains a long way overhead and is the only level that would change the character of the move. Relative strength versus Bitcoin is worth monitoring, since it usually precedes broader risk appetite returning to the asset class.
Summary:Traditional Asset Classes
| Asset | Price | MTD | QTD | YTD | Trend |
| S&P 500 | 7,489.72 | -0.1% | -0.1% | +9.4% | Bullish |
| Nasdaq Composite | 25,374 | -3.2% | -3.2% | +9.2% | Caut. Bullish |
| Russell 2000 | 2,931.34 | -3.1% | -3.1% | +18.1% | Caut. Bullish |
| US 10-Year Yield | 4.74% | +7.4% | +7.4% | +14.0% | Bullish |
| US Dollar (DXY) | 99.80 | -1.4% | -1.4% | +1.5% | Caut. Bullish |
| TLT (20Y Bond) | 82.25 | -4.5% | -4.5% | -3.5% | Bearish |
| LQD (IG Corp) | 106.25 | -2.2% | -2.2% | -1.4% | Bearish |
| HYG (High Yield) | 79.48 | -0.2% | -0.2% | +1.5% | Caut. Bullish |
| VNQ (Real Estate) | 98.95 | +2.6% | +2.6% | +14.0% | Bullish |
| WTI Crude Oil | 84.67 | +21.8% | +21.8% | +47.5% | Bullish |
| Copper | 6.44 | +3.9% | +3.9% | +14.3% | Bullish |
| Gold | 4,049.10 | +0.7% | +0.7% | -6.4% | Bearish |
| Silver | 57.59 | -3.2% | -3.2% | -17.9% | Bearish |
Summary:Crypto
| Asset | Price | MTD | QTD | YTD | Trend |
| Ethereum | 1,860.35 | +18.5% | +18.5% | -37.3% | Caut. Bearish |
| Monero | 358.34 | +18.2% | +18.2% | -17.3% | Caut. Bearish |
| Bitcoin | 62,814 | +7.3% | +7.3% | -28.2% | Bearish |
| Litecoin | 44.24 | +5.7% | +5.7% | -42.4% | Bearish |
| Ripple (XRP) | 1.06 | +2.1% | +2.1% | -42.4% | Bearish |
| Dogecoin | 0.0695 | -3.4% | -3.4% | -40.7% | Bearish |
Wrap Up
Strip out the noise, and July delivered one coherent message:the price of money went up, and everything got sorted by how much duration it was carrying.
Long Treasuries and investment grade —assets with nothing but duration —took the worst of it. Mega-cap tech, which the market has treated as a bond substitute, took the next worst.
Assets with real cash-flow escalators or commodity linkage held or gained. That is a rational, orderly repricing, not a risk event, and credit's refusal to widen confirms it.
The genuinely uncomfortable observation is the dollar falling as yields rose, which points to term premium and fiscal compensation rather than a hawkish policy path, which is a slower, more corrosive problem than a rate scare.
Meanwhile, gold's failure to respond to an energy shock and a weaker dollar suggests the inflation-hedge complex is still unwinding a crowded position rather than anticipating the next one.
Copper argues growth is fine. Crude argues the cost of everything is not.

A Crude Awakening
Posted October 23, 2026
By Sean Ring

All That Glitters Is Diesel
Posted October 22, 2026
By Sean Ring

Treason’s Greetings!
Posted October 21, 2026
By Sean Ring

Zach’s Second Opinion
Posted October 20, 2026
By Zach Scheidt

A COLA, But No Smile
Posted October 20, 2026
By Zach Scheidt