
Posted May 01, 2026

By Sean Ring
The Everything Rally Resumes
It seems the rally will continue until the bears’ morale improves.
US equities ripped higher, with the S&P 500 closing out April with a monthly gain of 10.4%, its largest since November 2020. Caterpillar, Alphabet, and a wall of Q1 earnings beats did the heavy lifting, and the index punched through 7,200 for the first time on the 30th.
Bonds got the opposite memo: the 10-year Treasury yield jumped about 7 bps to 4.42% on Wednesday, a new high in roughly a month, after a hawkish FOMC hold and three dissents led traders to price out cuts entirely and even sniff at a 2027 hike.
Crypto joined the party — Bitcoin closed April with an 11.87% gain, reclaiming $75,900 as institutions piled back into spot ETFs.
In short, stocks and crypto partied, while bonds got punished.
A quick reminder before we proceed:
The moving averages we use (10-week and 40-week, roughly equivalent to the 50-day and 200-day) are our primary trend filters. When the price is above both, the trend is with you. When it's below both, it isn't. Everything else is commentary. Please note that “cautiously bullish” or “cautiously bearish” is when the price is between the moving averages.
We cover fifteen assets across eight categories: US equities, rates, the dollar, bonds, real estate, energy, metals, and crypto. Each gets a chart, a stats table, and a short commentary. At the end, you'll find summary return tables across traditional assets and crypto, ranked by month-to-date performance.
S&P 500
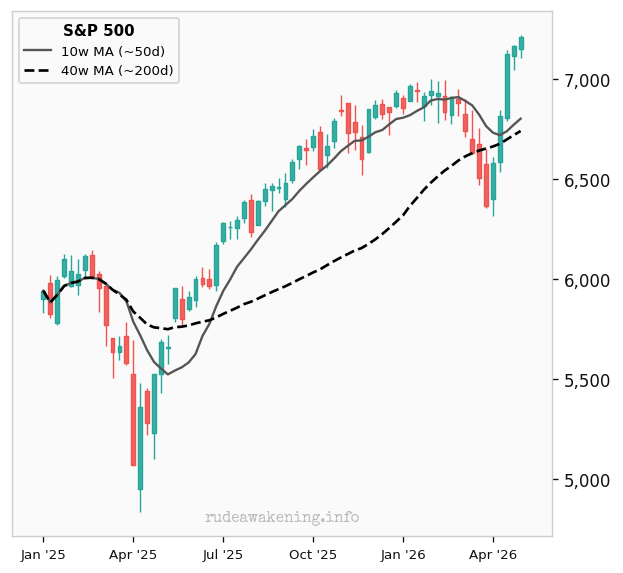
| March Close | 6,528.52 | Month-to-Date | +10.4% |
| April Close | 7,209.01 | Quarter-to-Date | +10.4% |
| Trend | Bullish | Year-to-Date | +5.3% |
Commentary
The S&P 500 closed the month at 7,209.01, +10.4% month-to-date. The index remains above both its 10-week MA (6,814.55) and 40-week MA (6,723.61), going from bearish to bullish just this past month. Is this real? Well, bull markets always climb a wall of worry. But you’d be crazy to short this right now.
Target / Risk
The upside target is 7,963… though we’re miles away from that right now.
Nasdaq Composite
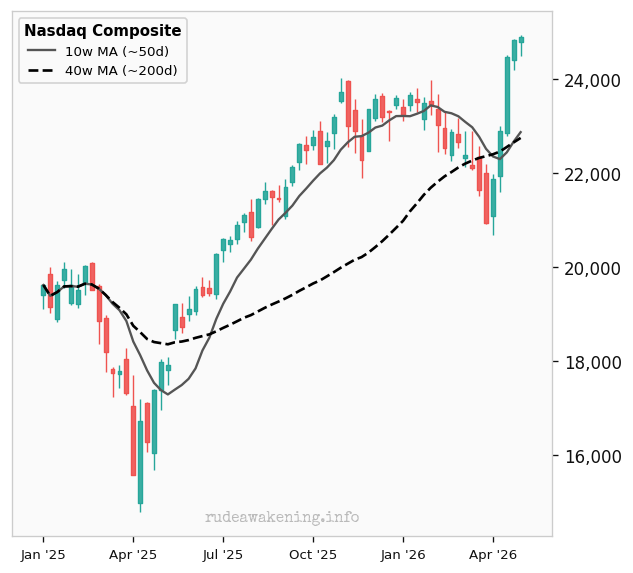
| March Close | 21,591 | Month-to-Date | +15.3% |
| April Close | 24,892 | Quarter-to-Date | +15.3% |
| Trend | Bullish | Year-to-Date | +7.1% |
Commentary
The Nasdaq Composite closed at 24,892, +15.3% month-to-date. The Composite holds above both its 10-week MA (22,877) and 40-week MA (22,687), a bullish technical posture. Mega-cap technology names that drove the 2024 rally have been the biggest drag, with multiple compressions hitting hardest where valuations were most stretched.
Target / Risk
Now, we’re looking at the 27,700 mark, about 11% upside from here.
Russell 2000
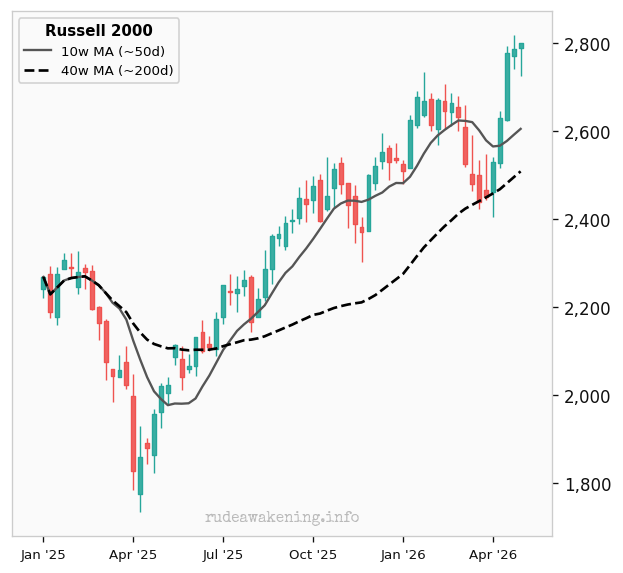
| March Close | 2,496.37 | Month-to-Date | +12.2% |
| April Close | 2,799.91 | Quarter-to-Date | +12.2% |
| Trend | Bullish | Year-to-Date | +12.8% |
Commentary
The Russell 2000 closed at 2,799.91, +12.2% month-to-date. The Russell holds above both its 10-week MA (2,612.31) and 40-week MA (2,495.17), a bullish setup. Small caps are more domestically oriented, offering some insulation from trade war fears, but they are also more exposed to tighter credit conditions and a slowing consumer.
Target / Risk
The target is 324, representing a 16.5% upside.
US 10-Year Yield
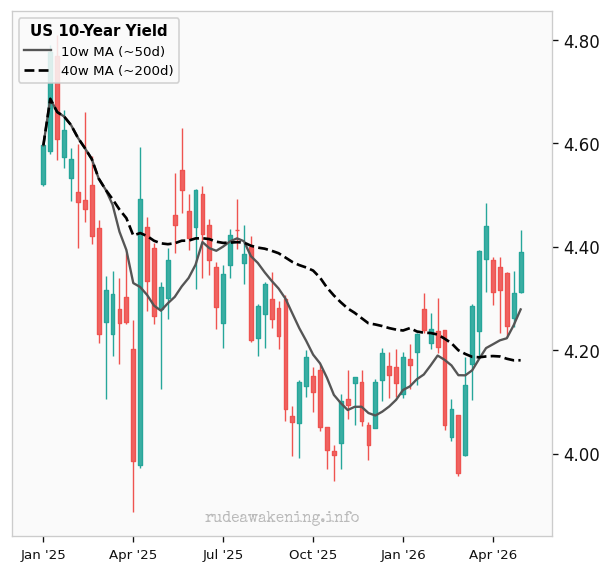
| March Close | 4.31% | Month-to-Date | +1.8% |
| April Close | 4.39% | Quarter-to-Date | +1.8% |
| Trend | Bullish | Year-to-Date | +5.5% |
Commentary
The US 10-year yield stands at 4.39%, +1.8% month-to-date. The bond market is pricing in persistent inflation and fiscal concerns, with the term premium rising as foreign buyers reduce their appetite for US Treasuries. (Those hedge funds in the Caymans flatter the official holdings.) Watch 4.5% as the key resistance: a sustained break above it would put pressure on equities.
Target / Risk
The only target is 4.96%. If we approach that, expect equities to sell off.
US Dollar (DXY)
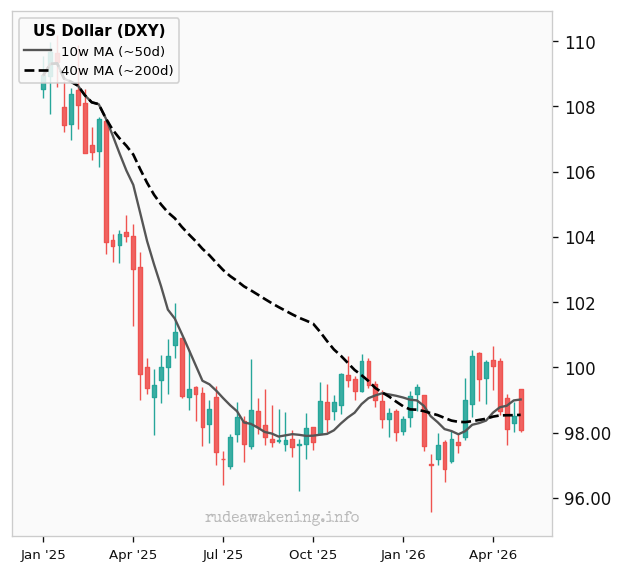
| March Close | 99.96 | Month-to-Date | -1.9% |
| April Close | 98.08 | Quarter-to-Date | -1.9% |
| Trend | Bearish | Year-to-Date | -0.2% |
Commentary
The US Dollar Index (DXY) closed at 98.08, -1.9% month-to-date. The trend is currently bearish, with the DXY below its 10-week MA (98.93) and 40-week MA (98.54). The longer-term backdrop remains dollar-bearish as twin-deficit concerns intensify.
Target / Risk
Though there’s a downside target of 79.75, we’ve been rangebound for a year.
TLT (20Y Bond)
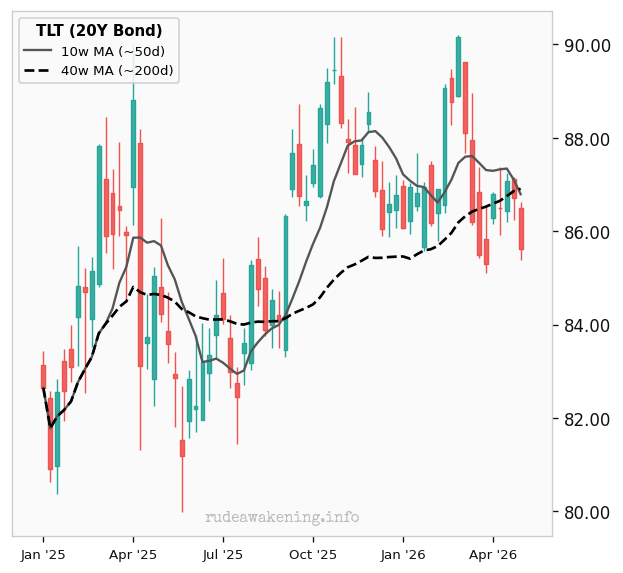
| March Close | 86.35 | Month-to-Date | -0.8% |
| April Close | 85.62 | Quarter-to-Date | -0.8% |
| Trend | Bearish | Year-to-Date | -0.7% |
Commentary
TLT closed at 85.62, -0.8% month-to-date, with the trend currently bearish. Long-duration bonds continue to bear the brunt of the yield rise. The risk here is a vicious cycle: rising yields tighten financial conditions, which in turn weaken growth.
Target / Risk
No current targets. We’ve been in a range from 83.30 to 92.20 for a year. Need to wait for a break either way.
LQD (IG Corp)
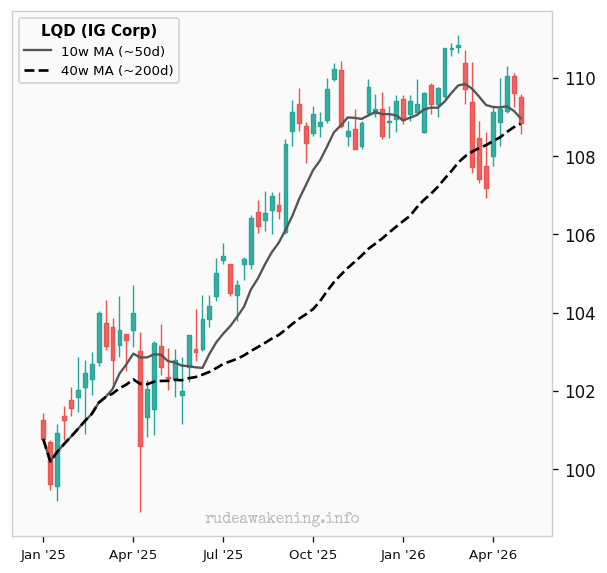
| March Close | 108.54 | Month-to-Date | +0.3% |
| April Close | 108.85 | Quarter-to-Date | +0.3% |
| Trend | Caut. Bullish | Year-to-Date | -0.1% |
Commentary
LQD closed at 108.85, +0.3% month-to-date. Credit spreads have widened modestly as growth fears build, though the move has been orderly — markets are not yet pricing in a recession. The key risk is LQD could roll over, but it’s too early to tell.
Target / Risk
No current targets. Waiting for trend reversal confirmation.
HYG (High Yield)
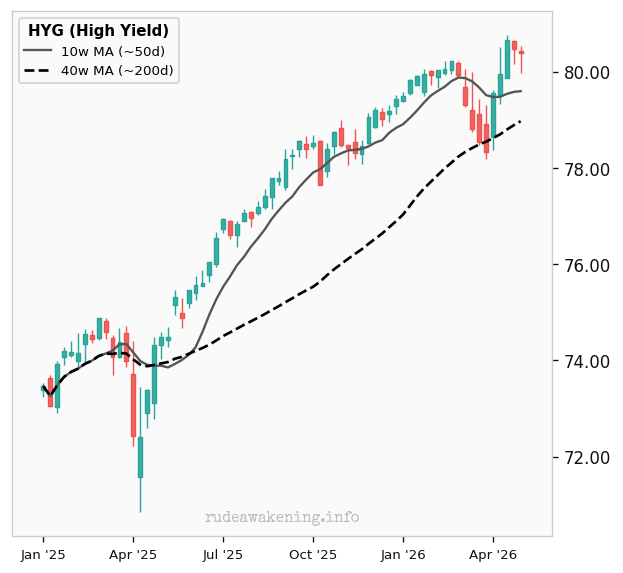
| March Close | 79.18 | Month-to-Date | +1.5% |
| April Close | 80.38 | Quarter-to-Date | +1.5% |
| Trend | Bullish | Year-to-Date | +1.2% |
Commentary
HYG closed at 80.38, +1.5% month-to-date. High yield is bullish, with the ETF above its 10-week MA (79.75) and 40-week MA (78.88). A deterioration in the jobs market could see spreads blow out quickly.
Target / Risk
No activated targets yet.
VNQ (Real Estate)
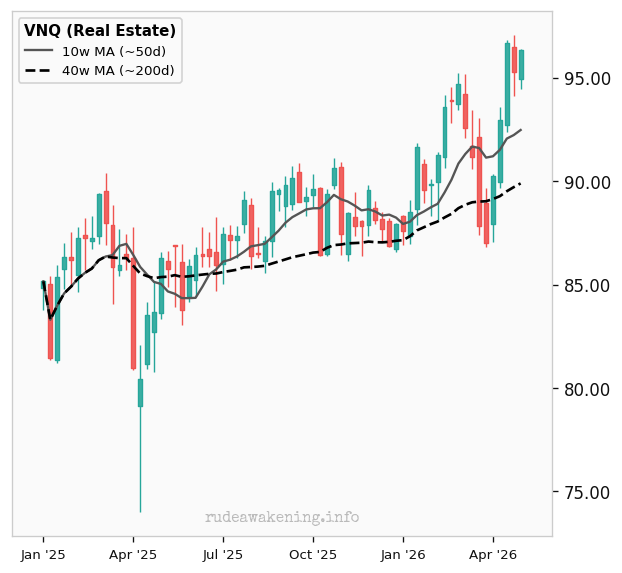
| March Close | 88.70 | Month-to-Date | +8.6% |
| April Close | 96.33 | Quarter-to-Date | +8.6% |
| Trend | Bullish | Year-to-Date | +10.0% |
Commentary
VNQ closed at 96.33, +8.6% month-to-date. Office property remains structurally challenged post-pandemic, and residential REITs face affordability headwinds. And yet, the trend is clearly bullish for now.
Target / Risk
No current targets.
WTI Crude Oil
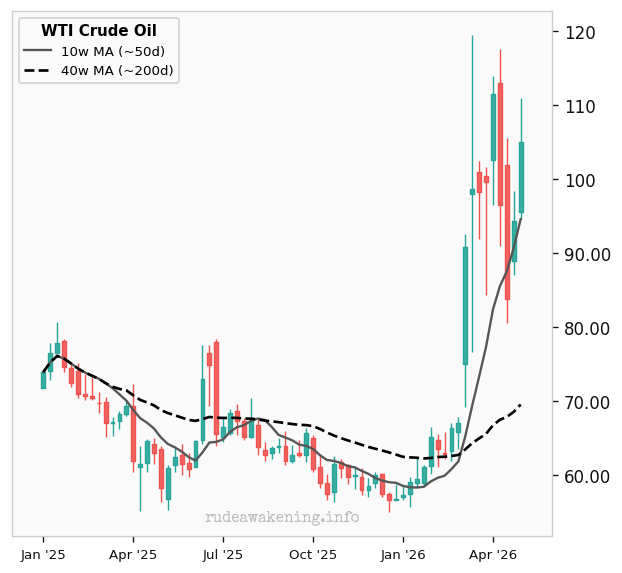
| March Close | 101.38 | Month-to-Date | +3.6% |
| April Close | 105.07 | Quarter-to-Date | +3.6% |
| Trend | Bullish | Year-to-Date | +83.0% |
Commentary
WTI Crude (rolling front-month) closed at 105.07, +3.6% month-to-date. Crude has been supported by geopolitical risk premiums, though demand concerns tied to a slowing global economy are capping upside. Also, every time WTI gets too hot, the White House posts on X that Iran is capitulating or some such nonsense. The supply-demand balance remains tight.
Target / Risk
The current upside target is 128.10.
Copper
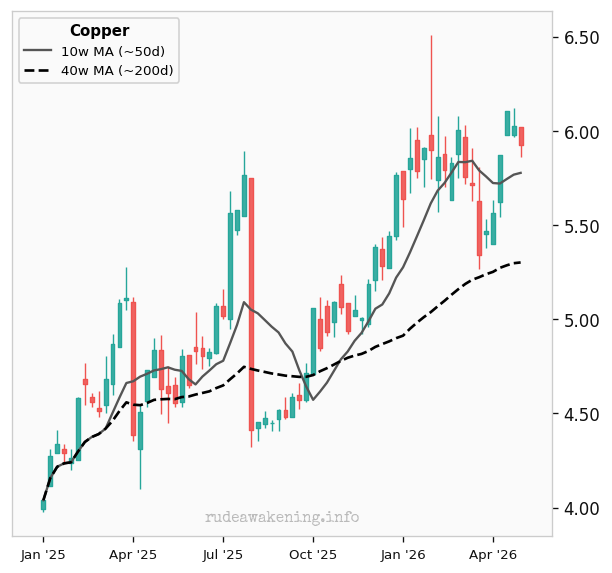
| March Close | 5.59 | Month-to-Date | +6.1% |
| April Close | 5.93 | Quarter-to-Date | +6.1% |
| Trend | Bullish | Year-to-Date | +5.3% |
Commentary
Copper futures closed at 5.93, +6.1% month-to-date. Copper has been reassessing the pace of the global manufacturing recovery, with China's property sector remaining a structural drag despite stimulus measures. The long-term electrification and energy transition story keeps a floor under prices. The physical market is genuinely tight.
Target / Risk
The current upside target is 6.93.
Gold
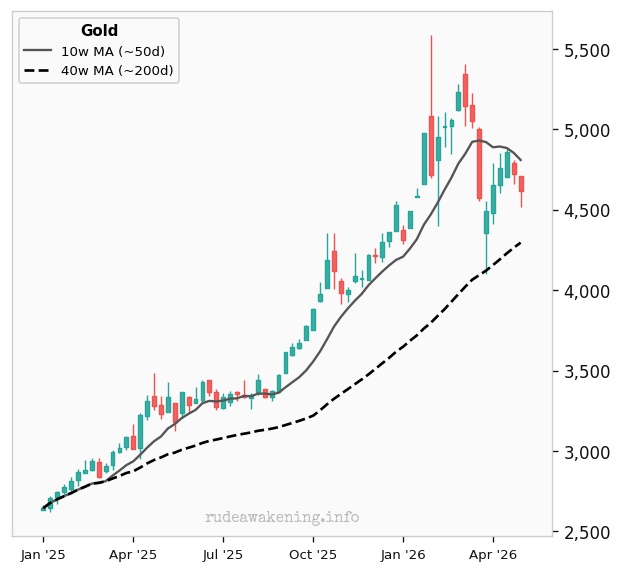
| March Close | 4,647.60 | Month-to-Date | -0.7% |
| April Close | 4,614.70 | Quarter-to-Date | -0.7% |
| Trend | Caut. Bullish | Year-to-Date | +6.7% |
Commentary
Gold (rolling front-month) closed at 4,614.70, -0.7% month-to-date. The yellow metal has decoupled from its traditional inverse relationship with real yields — a structural shift worth watching. From a technical perspective, I’m still not convinced.
Target / Risk
We have a short-term upside target of 5,505. But we also have a longstanding downside target of 3,495.
Silver
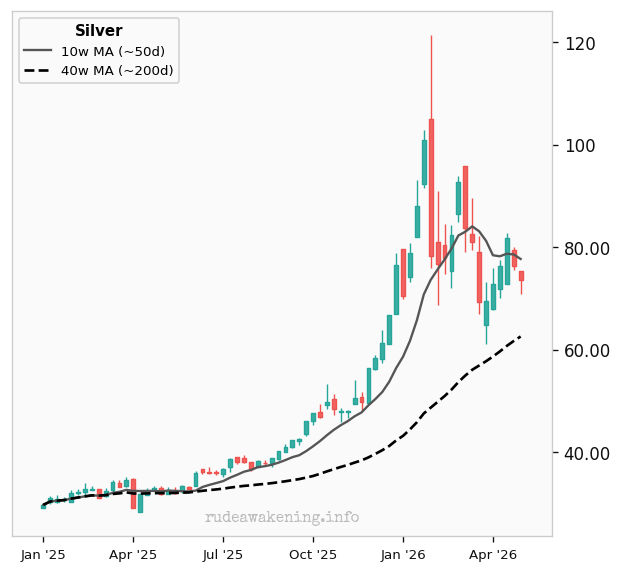
| March Close | 74.69 | Month-to-Date | -1.5% |
| April Close | 73.53 | Quarter-to-Date | -1.5% |
| Trend | Caut. Bullish | Year-to-Date | +4.8% |
Commentary
Silver (rolling front-month) closed at 73.53, -1.5% month-to-date. Silver faces pressure from a slowing global manufacturing cycle. The gold/silver ratio has widened, historically a sign of risk-off conditions. When the cycle turns, silver tends to outperform gold sharply. Patience may reward bulls, but timing is everything.
Target / Risk
The immediate downside target is 63.40. The next target is an eyewatering 36.80.
Bitcoin
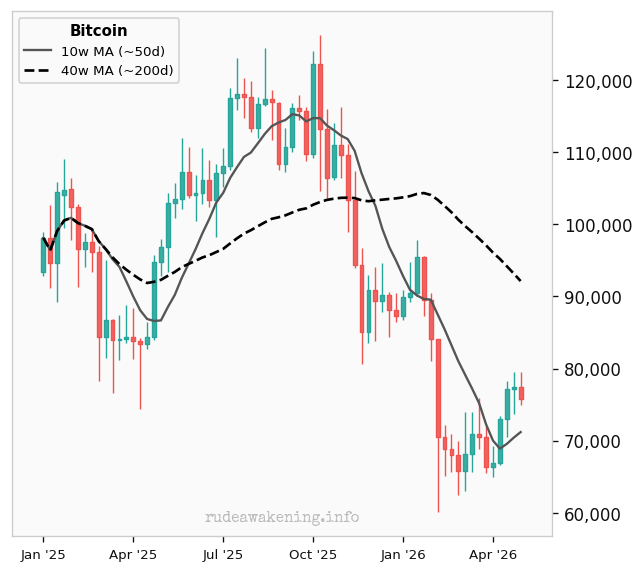
| March Close | 68,233 | Month-to-Date | +11.1% |
| April Close | 75,776 | Quarter-to-Date | +11.1% |
| Trend | Caut. Bearish | Year-to-Date | -13.4% |
Commentary
Bitcoin closed at 75,776, +11.1% month-to-date. Bitcoin has shown some resilience relative to equities, a modest decoupling that crypto bulls will point to as evidence of maturing as an asset class. We may have hit the bottom last month.
Target / Risk
BTC has an older downside target of 55,420. It has a newer, upside target of 87,690.
Ethereum
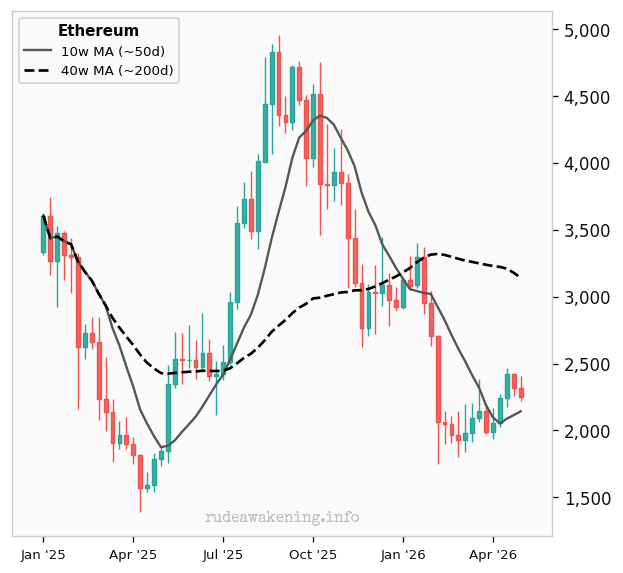
| March Close | 2,104.71 | Month-to-Date | +7.1% |
| April Close | 2,253.42 | Quarter-to-Date | +7.1% |
| Trend | Caut. Bearish | Year-to-Date | -24.1% |
Commentary
Ethereum has been the weaker of the two major cryptos, with the ETH/BTC ratio in a persistent downtrend as Bitcoin dominance rises in risk-off environments. But ETH may be staging a comeback.
Target / Risk
The next upside target is 2,454.
Summary: Traditional Asset Classes
| Asset | Price | MTD | QTD | YTD | Trend |
| S&P 500 | 7,209.01 | +10.4% | +10.4% | +5.3% | Bullish |
| Nasdaq Composite | 24,892 | +15.3% | +15.3% | +7.1% | Bullish |
| Russell 2000 | 2,799.91 | +12.2% | +12.2% | +12.8% | Bullish |
| US 10-Year Yield | 4.39% | +1.8% | +1.8% | +5.5% | Bullish |
| US Dollar (DXY) | 98.08 | -1.9% | -1.9% | -0.2% | Bearish |
| TLT (20Y Bond) | 85.62 | -0.8% | -0.8% | -0.7% | Bearish |
| LQD (IG Corp) | 108.85 | +0.3% | +0.3% | -0.1% | Caut. Bullish |
| HYG (High Yield) | 80.38 | +1.5% | +1.5% | +1.2% | Bullish |
| VNQ (Real Estate) | 96.33 | +8.6% | +8.6% | +10.0% | Bullish |
| WTI Crude Oil | 105.07 | +3.6% | +3.6% | +83.0% | Bullish |
| Copper | 5.93 | +6.1% | +6.1% | +5.3% | Bullish |
| Gold | 4,614.70 | -0.7% | -0.7% | +6.7% | Caut. Bullish |
| Silver | 73.53 | -1.5% | -1.5% | +4.8% | Caut. Bullish |
Summary: Crypto
| Asset | Price | MTD | QTD | YTD | Trend |
| Monero | 376.22 | +13.0% | +13.0% | -13.2% | Caut. Bearish |
| Dogecoin | 0.1040 | +12.8% | +12.8% | -11.3% | Caut. Bearish |
| Bitcoin | 75,776 | +11.1% | +11.1% | -13.4% | Caut. Bearish |
| Ethereum | 2,253.42 | +7.1% | +7.1% | -24.1% | Caut. Bearish |
| Litecoin | 55.30 | +2.6% | +2.6% | -28.0% | Caut. Bearish |
| Ripple (XRP) | 1.37 | +2.2% | +2.2% | -25.6% | Bearish |
Notice how, while cryptocurrencies are down year-to-date, they posted sharp gains last month. We may have seen the bottom.
Wrap Up
It looks like we’re in a risk-on environment, with stocks and crypto leading the way.
Let’s have a laugh, courtesy of the X-verse:
Have a great weekend!

The False Boom
Posted May 22, 2026
By Sean Ring

Who Ate the Seed Corn?
Posted May 21, 2026
By Sean Ring

The Ratchet Turns
Posted May 20, 2026
By Sean Ring

The War on Waiting
Posted May 19, 2026
By Sean Ring

Dr. No: The Man With the Golden Parachute
Posted May 18, 2026
By Ray Blanco
