Posted May 07, 2024

By Sean Ring
RALLY!
It's crucial to seize the opportunities in this market. The Rude has been consistently bullish since the end of last year, and this trend is projected to persist in the near future. Now is not the time to be on the sidelines; instead, actively participate and reap profits.
We start from political premises. There are two huge reasons this market will continue climbing the “wall of worry.”
One of the key factors driving the market’s upward trajectory is the election year in the four-year cycle. Politicians, including Joke Biden, incentivize the electorate to secure their votes. As H.L. Mencken once astutely observed, this political dynamic turns every election into an “advance auction sale of stolen goods.”
What Mencken implies correctly is that the stolen goods are yours.
The second reason is that however stupid Jay Powell may feel cutting rates in this economy, he’ll do it. And he’ll do it not out of duty to Joe Biden, as Arthur Burns did with Nixon. But he’ll do it because he doesn’t want to work for Donald Trump ever again. (And since Trump said he would fire Powell if he gets re-elected, Powell has even more incentive to put his thumb on the electoral scale.)
As I near my 50th birthday, I’m too old to be outraged by these political machinations. Someone once said, “Trading is the act of becoming inhuman.” That, combined with writing about this stuff daily, has anesthetized me. So, with a clear head, we can take stock of where the market currently stands to see where it may be going.
I’m not saying the market will go straight up for the rest of the year, but I’m sure it will be higher in November than now.
Let’s get into the reasons why. I thank Patrick Dunuwila, CMT, Editor of The Chart Report, for organizing the below charts.
The 10-Year Yield and The Dollar
The first chart is The Chart Report’s Chart of the Day:
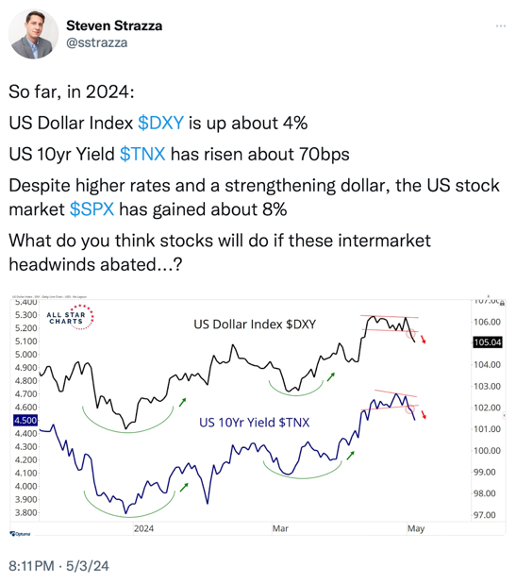
Steve Strazza makes a great point here. Despite the ten-year yield and the dollar rallying this year, the stock market (and precious metals) also have. While this occasionally happens, it’s not the usual case. This is where the Fed comes in. If Powell cuts rates, the dollar will fall, and perhaps the 10-year yield. (The Fed only controls short-term rates and prays for long-term rates to follow.)
A falling 10-year yield and USD will goose all asset classes, especially stocks and metals.
Momentum is Bullish
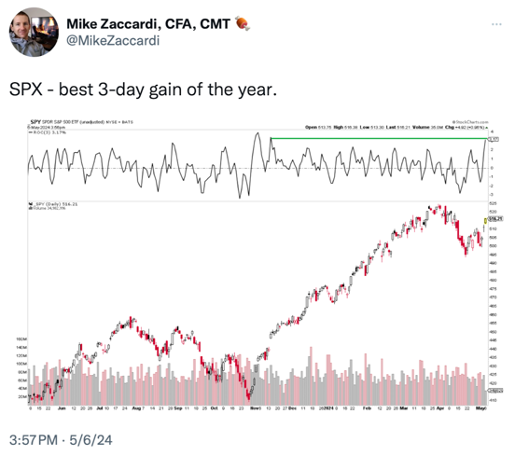
We’ve just had the best 3-day gain of 2024. This isn’t characteristic of bear markets.
Also, notice that squiggly line above the price chart. It’s the rate of change.
From StockCharts.com’s Chart School:
The Rate-of-Change (ROC) indicator, also known as Momentum, is a pure momentum oscillator that measures the percent change in price from one period to the next. The ROC calculation compares the current price with the price “n” periods ago. The plot forms an oscillator that fluctuates above and below the zero line as the rate of change moves from positive to negative.
The current momentum is the best since this rally started.
Reclaiming the All-time High
We haven’t reclaimed the ATH, but that’s when we can get excited. Above 5,255, and we’re off to 6,000.
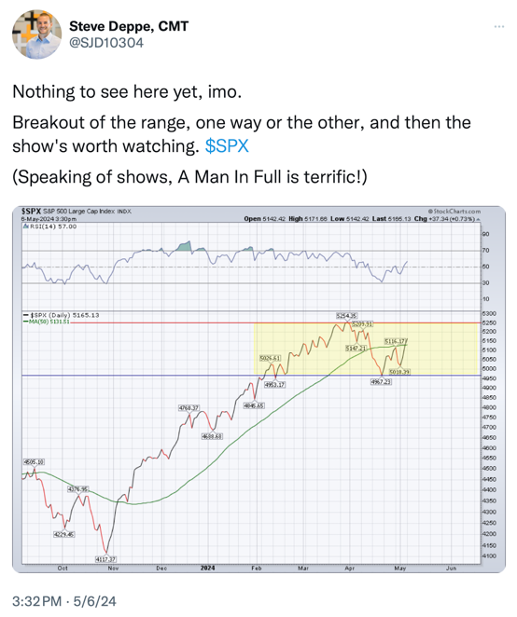
Of course, we can break down. But the probability of that happening is low. Why? See below.
The 50-day and 200-day Moving Averages
The price relative to its 50-day moving average tells us if we’re in an intermediate-term bull or bear market. Above the 50 DMA, we’re bullish. Below it, we’re bearish. We just got bullish again.
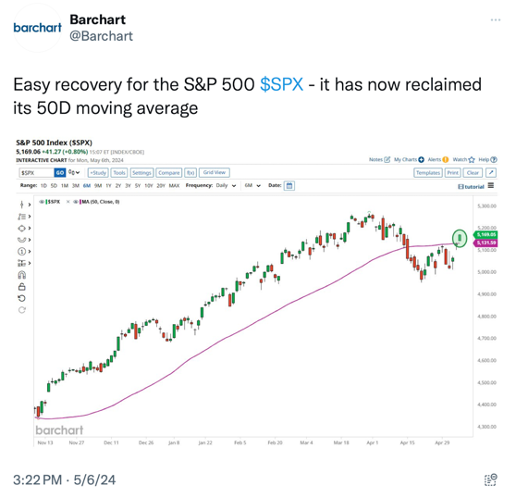
The 200-day moving average has just broken out to an all-time high. Like the 50-day moving average, the 200-day moving average relative to price tells us whether we’re in a long-term bull or bear market. We’re miles above the 200-day moving average.
And now, for some metals charts of my own.
Gold
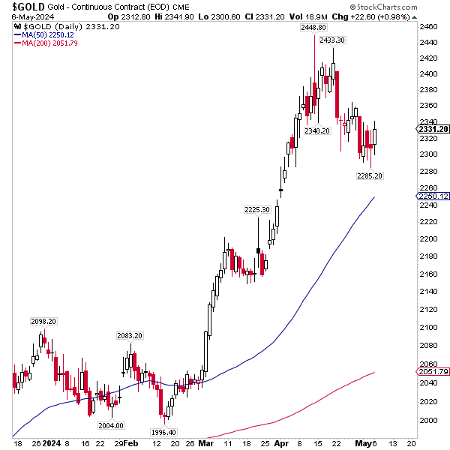
When an asset ascends too rapidly, it needs to take a breather. If you notice the chart below, gold almost went straight up from the end of February to the third week of April. It broke too far away from its 50-day moving average.
So, it took a breather. This pause will probably take us to the 50-day moving average, and then we’ll start our ascent again. Above the best close of 2,420 is good. Above the intraday high of 2,448.80 is better.
Silver
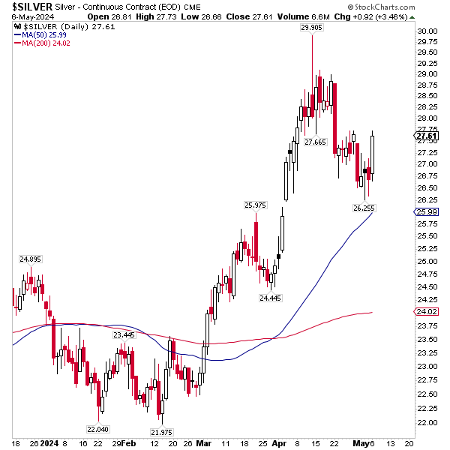
We also had a big up candle yesterday in silver. Again, above 29.00 is good. But it's better when silver gets above 29.91 (and maybe even off to the races).
Crypto
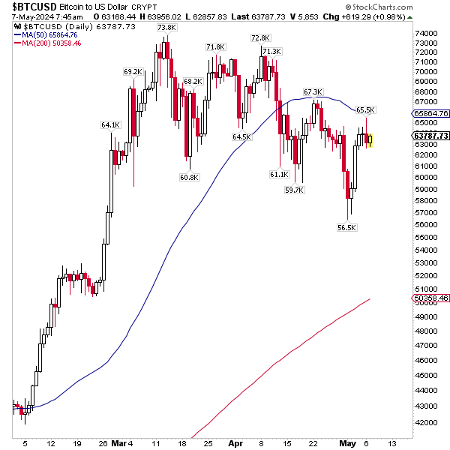
I find this baffling. Is crypto draining back into the yellow metal? Could that be?
Because as I look at this chart, I’m not optimistic.
It looks like lower highs and lower lows. And Bitcoin has fallen under its 50-day moving average. Its 200-day moving average may act like support later. It’s possible.
But this is, by far, the most bearish chart in today’s newsletter. Proceed with caution.
Wrap Up
The SPX is looking great, as does gold and silver. We had a great day yesterday in those asset classes. I still loathe bonds in this inflationary environment, though they’d benefit from a rate cut, if only temporarily.
The central banks are already in gold. Are the coiners draining into the yellow metal?
Surely not. It’s too fanciful.
Nevertheless, gold and silver are having their days. Bitcoin wishes it stayed in bed.

The Half-Life of a Bargain
Posted October 14, 2026
By Matt Badiali

Pump and Circumstance
Posted October 13, 2026
By Sean Ring

The Crusade That Never Paid
Posted October 12, 2026
By Sean Ring

No Farewell to Arms
Posted October 09, 2026
By Sean Ring

Just Blew It.
Posted October 08, 2026
By Sean Ring