
Posted May 10, 2024
By Sean Ring
Major Miners
When I had a conversation with the renowned Rick Rule last week, he shared an intriguing insight. He pointed out that central banks were essentially hosting a gold party, and when retail investors eventually wake up from their slumber, it could propel gold and silver to unprecedented heights.
It's important to note that Rick’s analysis is not based on mere speculation, but on simple mathematics. He suggests that gold could potentially reach a staggering $8,000 to $10,000. His rationale is straightforward: the historical average portfolio holding of gold is 2.0%, but it’s currently a mere 0.5%. Therefore, a return to the mean, or the average, could quadruple the gold price from its current level.
And how will that mean reversion happen?
When retail buyers return to gold. (And silver, too, but we’ll get to that later.)
If you’re a Strategic Intelligence subscriber, you’d have seen that yesterday, my esteemed colleague Jim Rickards wrote, “I have updated my forecast that gold will move past $25,000 per ounce by 2026 or sooner. That’s not a guess; it’s the result of rigorous analysis.”
Jim continues:
U.S. M1 money supply is $17.9 trillion. (I use M1, which is a good proxy for everyday money).
What is M1? This is the supply that is the most liquid and money that is the easiest to turn into cash. It contains actual cash (bills and coins), bank reserves (what is actually kept in the vaults), and demand deposits (money in your checking account that can be turned into cash easily).
The total amount of official gold the U.S. has is 8,133 metric tonnes. That equals 261.5 million troy ounces.
One needs to make an assumption about the percentage of gold backing for the money supply needed to maintain confidence. I assume 40% coverage with gold. (This was the legal requirement for the Fed from 1913 to 1946. Later it was 25%, then zero today).
Applying the 40% ratio to the $17.9 trillion money supply means that $7.2 trillion of gold is required.
Applying the $7.2 trillion valuation to 261.5 million troy ounces yields a price of $27,533 per Troy ounce of gold. That’s the implied non-deflationary equilibrium price of gold in a new global gold standard.
To paraphrase my favorite fictional libertarian Ronald Ulysses Swanson, just reading, copying, and pasting that gave me a semi.
Anyway…
Right on cue, the Twitterverse (or X-verse, now?) erupted with a bunch of charts I’ve collected and curated for your edification. If you’re already long gold and silver, this will only enhance your confirmation bias. Your FOMO (Fear Of Missing Out) bells will ring if you're not.
We’ll start with the fear trade (gold) and move on to the greed trade (silver).
Gold
First, let’s start with Northstar Charts.
This chart shows what we already know. At first, Gold kept bumping its head on the overhead $2,000 resistance. In a reverse of polarity, that resistance, once broken, became support. Now, it looks like gold will remain above $2,000 for good. (Though Northstar cautioned we may get an ugly move to $1,900 or so before we recover.
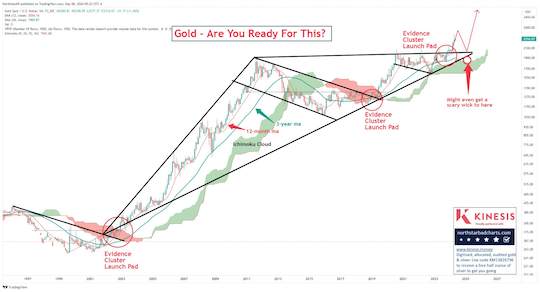
Credit: @NorthstarCharts
Next, Jesse Colombo looks at gold’s current bull flag pattern.
From StockCharts.com’s Chart School:
Flags are short-term continuation patterns that mark a small consolidation before the previous move resumes. These patterns are usually preceded by a sharp advance or decline with heavy volume, and mark a midpoint of the move.
Importantly, it’s a consolidation and continuation pattern. That means it’s taking a breather before resuming its uptrend.
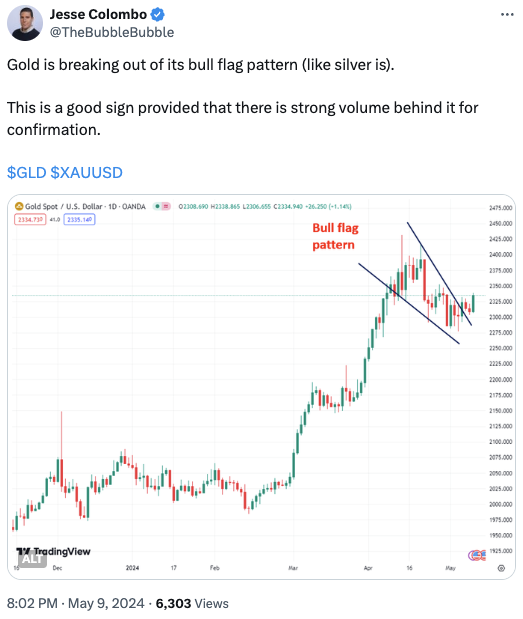
Credit: @The BubbleBubble
Let’s move on to silver.
Silver
Tavi Costa is usually excellent. I’ve followed him for years.
Here, he writes about why silver is so important. Then, he shows a chart of the silver price and explains why he thinks we’re heading up from here. (Hint: it’s another bull flag, similar to gold’s.)
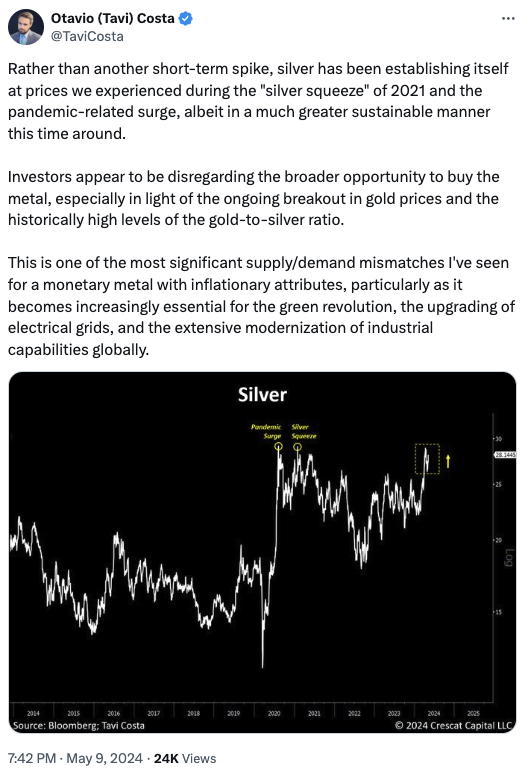
Credit: @TaviCosta
Next, venerable trader Peter Brandt shows another chart pattern, known as an area island or island reversal pattern.
Again, from StockCharts.com:
An island reversal is a reversal pattern that forms with two gaps and price action in between the two gaps. These gaps tell us that the island reversal marks a sudden, and sharp, shift in direction. Even though they are relatively uncommon, island reversals are potent patterns that warrant our attention.
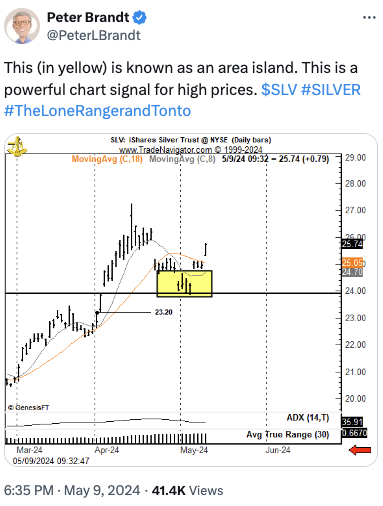
Credit: @PeterLBrandt
Notice how silver reversed course after the island reversal.
Next, onto the main event: the miners.
The Miners
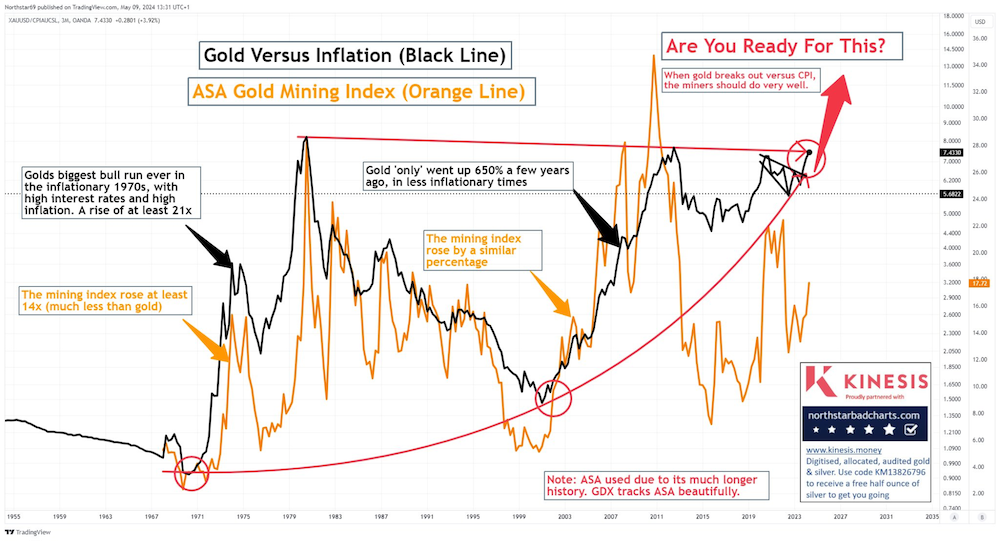
In this chart, Northstar shows the tremendous gap between gold (black line) and the gold miners (orange line). Northstar writes, “When gold breaks out versus the CPI, the miners should do very well.”
The miners, indeed, have much catching up to do!
Credit: @NorthstarCharts
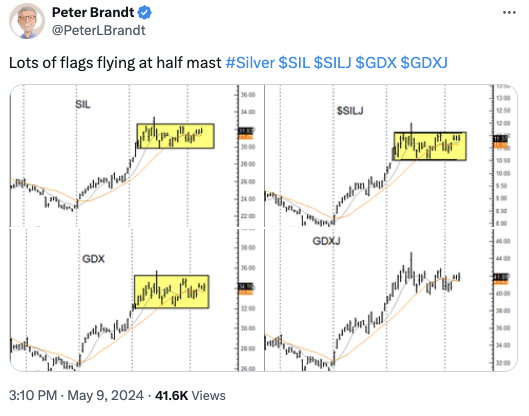
Next, Peter Brandt points out all the bull flags in the gold and silver miners and gold and silver junior miners.
Credit: @PeterLBrandt
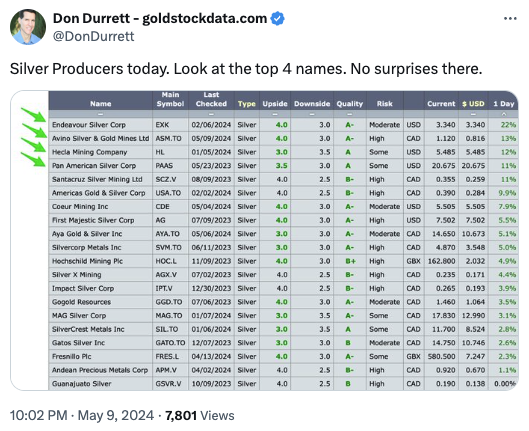
Finally, Don Durrett, who runs Gold Stock Data, gave out his four favorite silver miner stocks on X.
Credit: @DonDurrett
Don also posts videos on YouTube. His latest analysis of 24 Large Cap Gold/Silver Producers is worth watching, especially if you’re after new tickers to invest in!
Wrap Up
I’m loathe to sound like other newsletter writers who tell their readers, “You must act now! If you don’t, you’ll lose out forever!”
But I genuinely believe it’s the time of the precious metals and their miners.
I hope you participate in this exciting opportunity, as your involvement is crucial in creating the life you want for you and your family.
You deserve it!
Have a great weekend.

The Most Expensive Way to Go Broke
Posted February 18, 2026
By Sean Ring

The Bears Gather
Posted February 17, 2026
By Sean Ring

Omar Khayyam: Poet, Rebel, Astronomer
Posted February 16, 2026
By Sean Ring

The Devil in Mexican Mining
Posted February 13, 2026
By Matt Badiali

Is Civil War on the Cards?
Posted February 12, 2026
By Jim Rickards

